
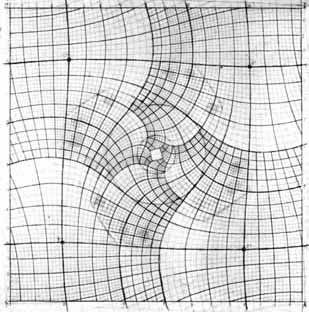
Here is M.C. Escher's "Print Gallery", and a sketch he made for it:
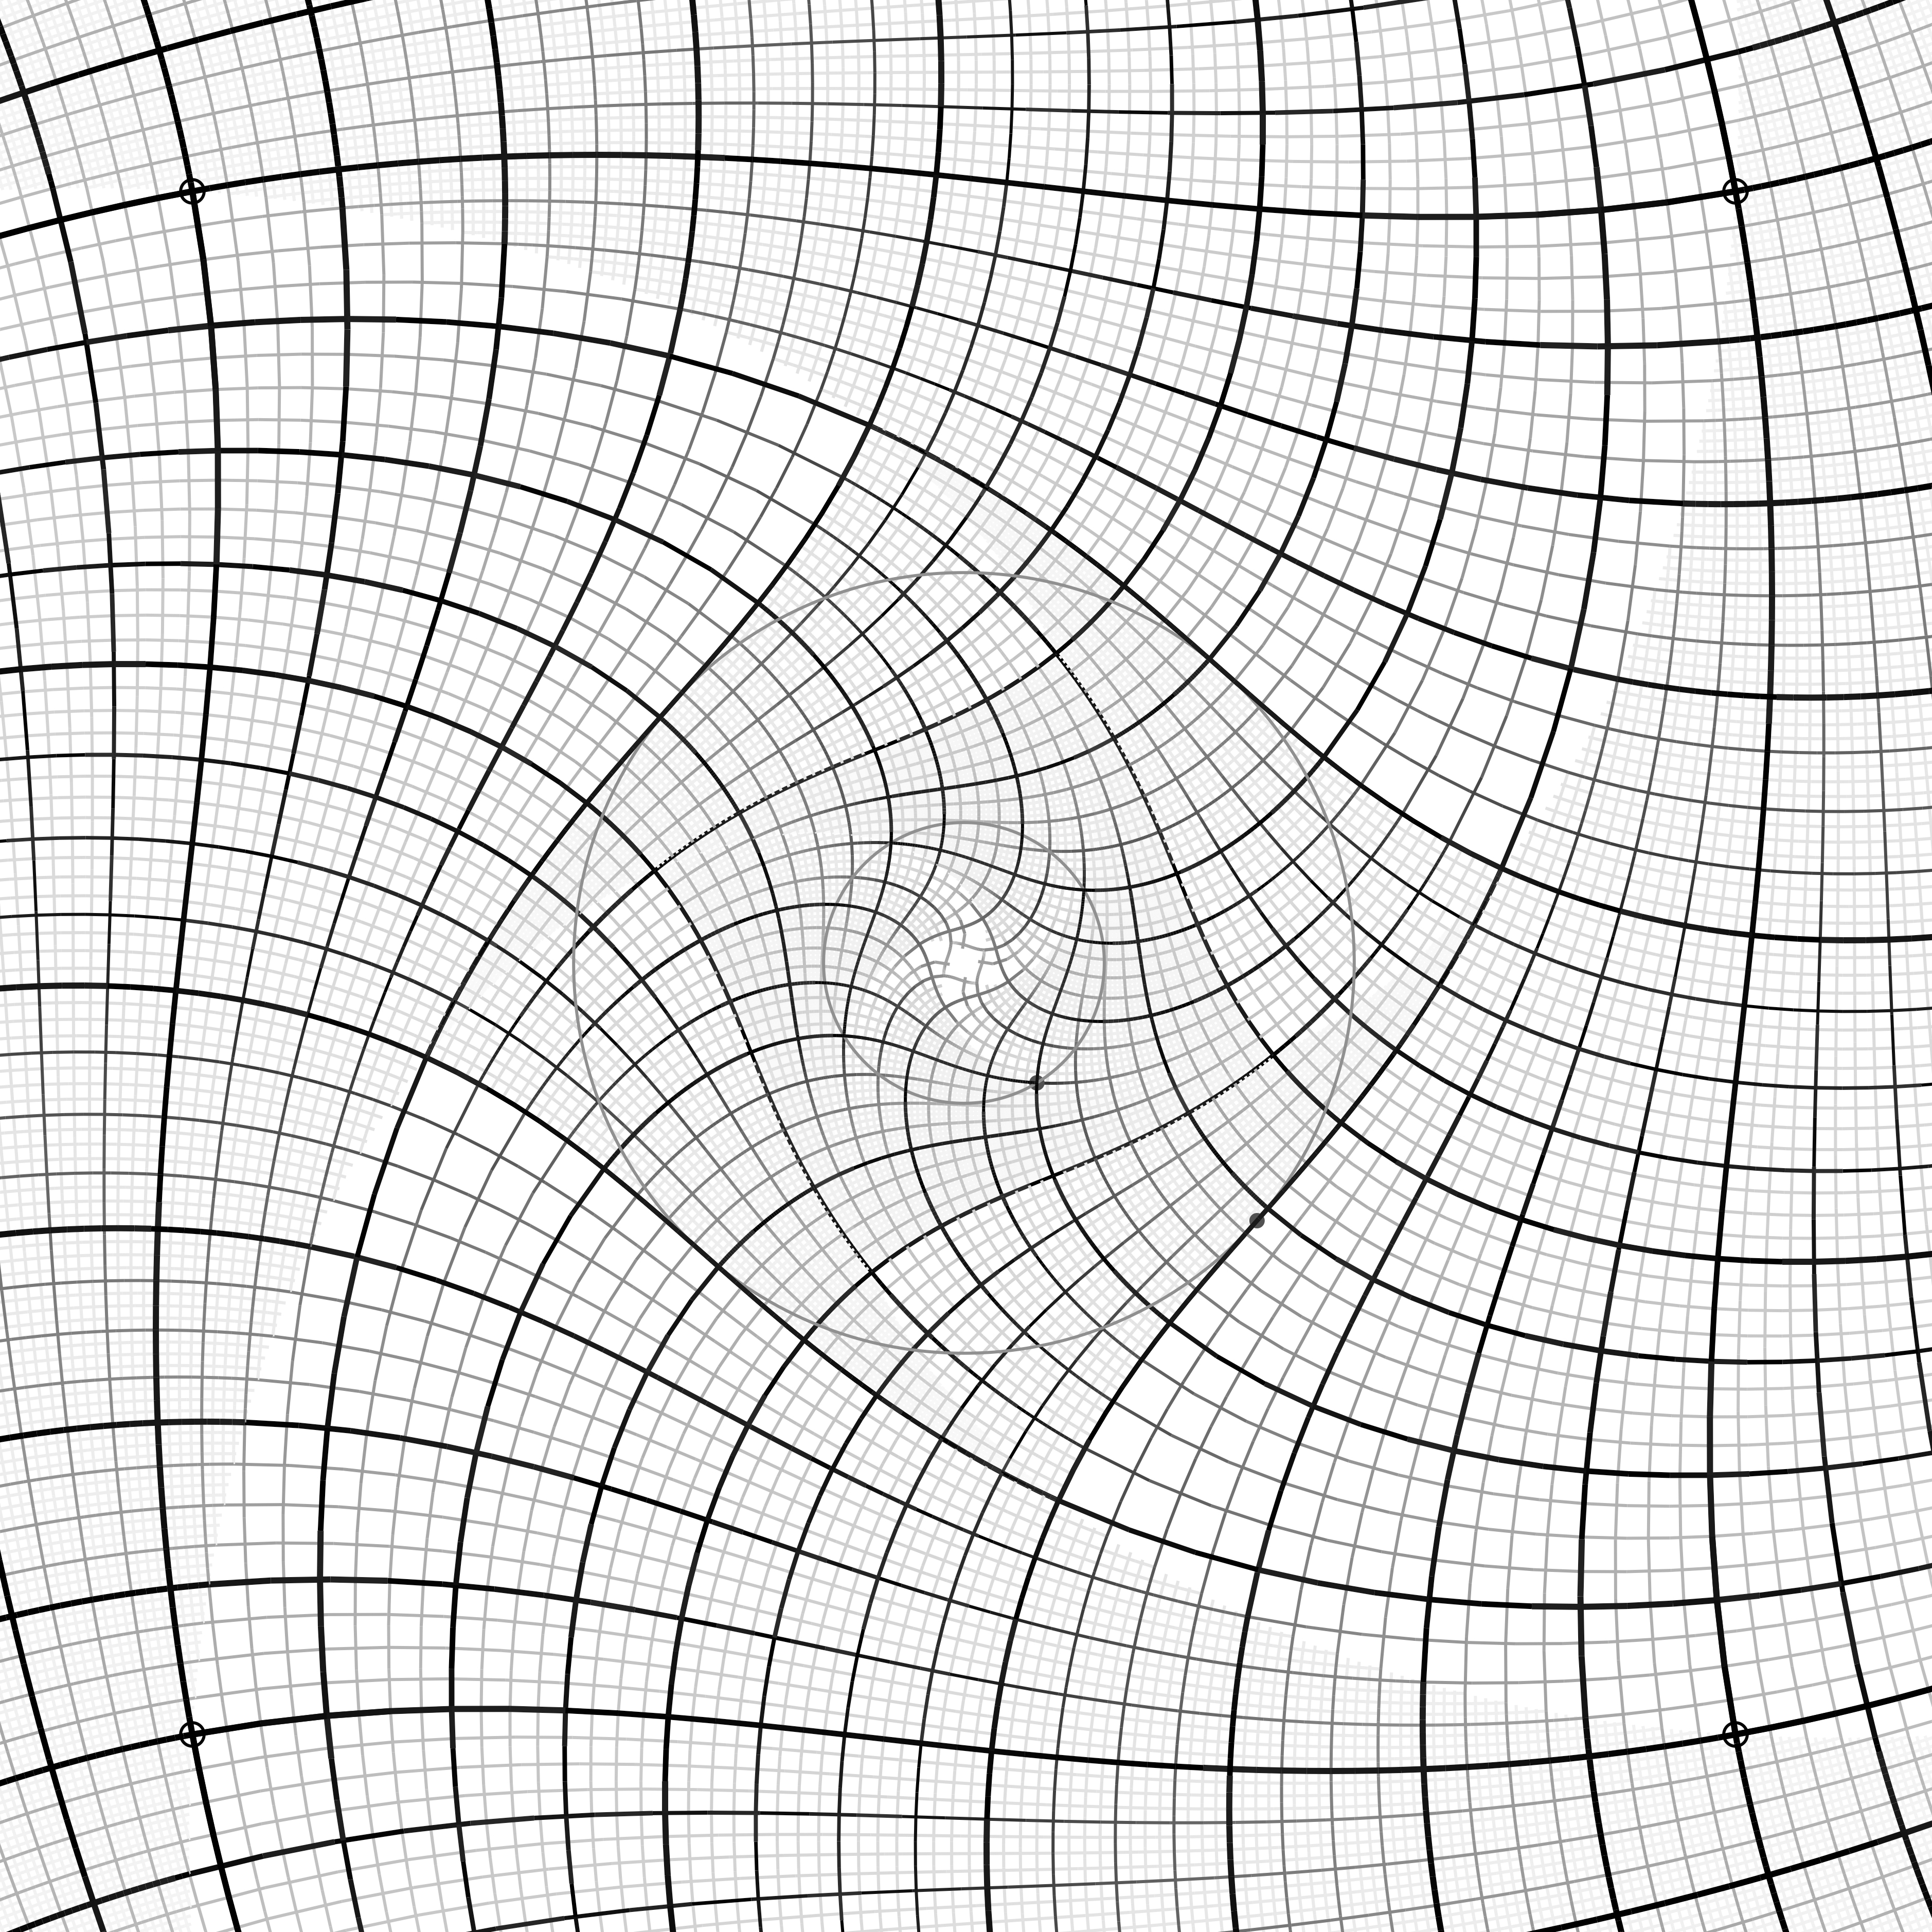
I love the grid and I wanted to try to get a computer to do something like it. My first try was reminiscent but wasn't the same grid. Here is the state of my second-generation attempt:
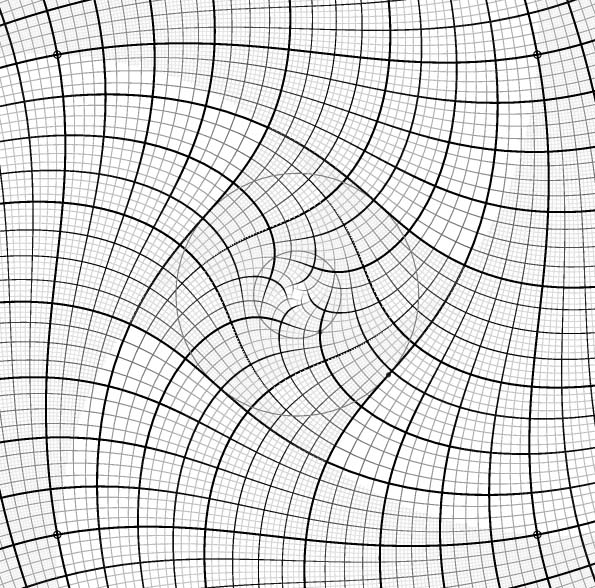
escher_grid.ps is the Postscript file that produces this grid. (If your browser won't show that directly, try escher_grid_ps.txt.) If you print it with a Postscript printer, or display it with GhostScript, GhostView or MacGhostview, there is a delay of a couple minutes, depending on your printer or computer's processor speed. Postscript files really are computer programs, and this one calculates and draws a lot of tiny curve pieces.
I found the necessary formula through the "Escher and the Droste Effect" web site, which shows some computer re-creations, variations and animations of "Print Gallery." The paper "The Mathematical Structure of Escher's Print Gallery," by Hendrik Lenstra and Bart de Smit, explains the math behind the picture.
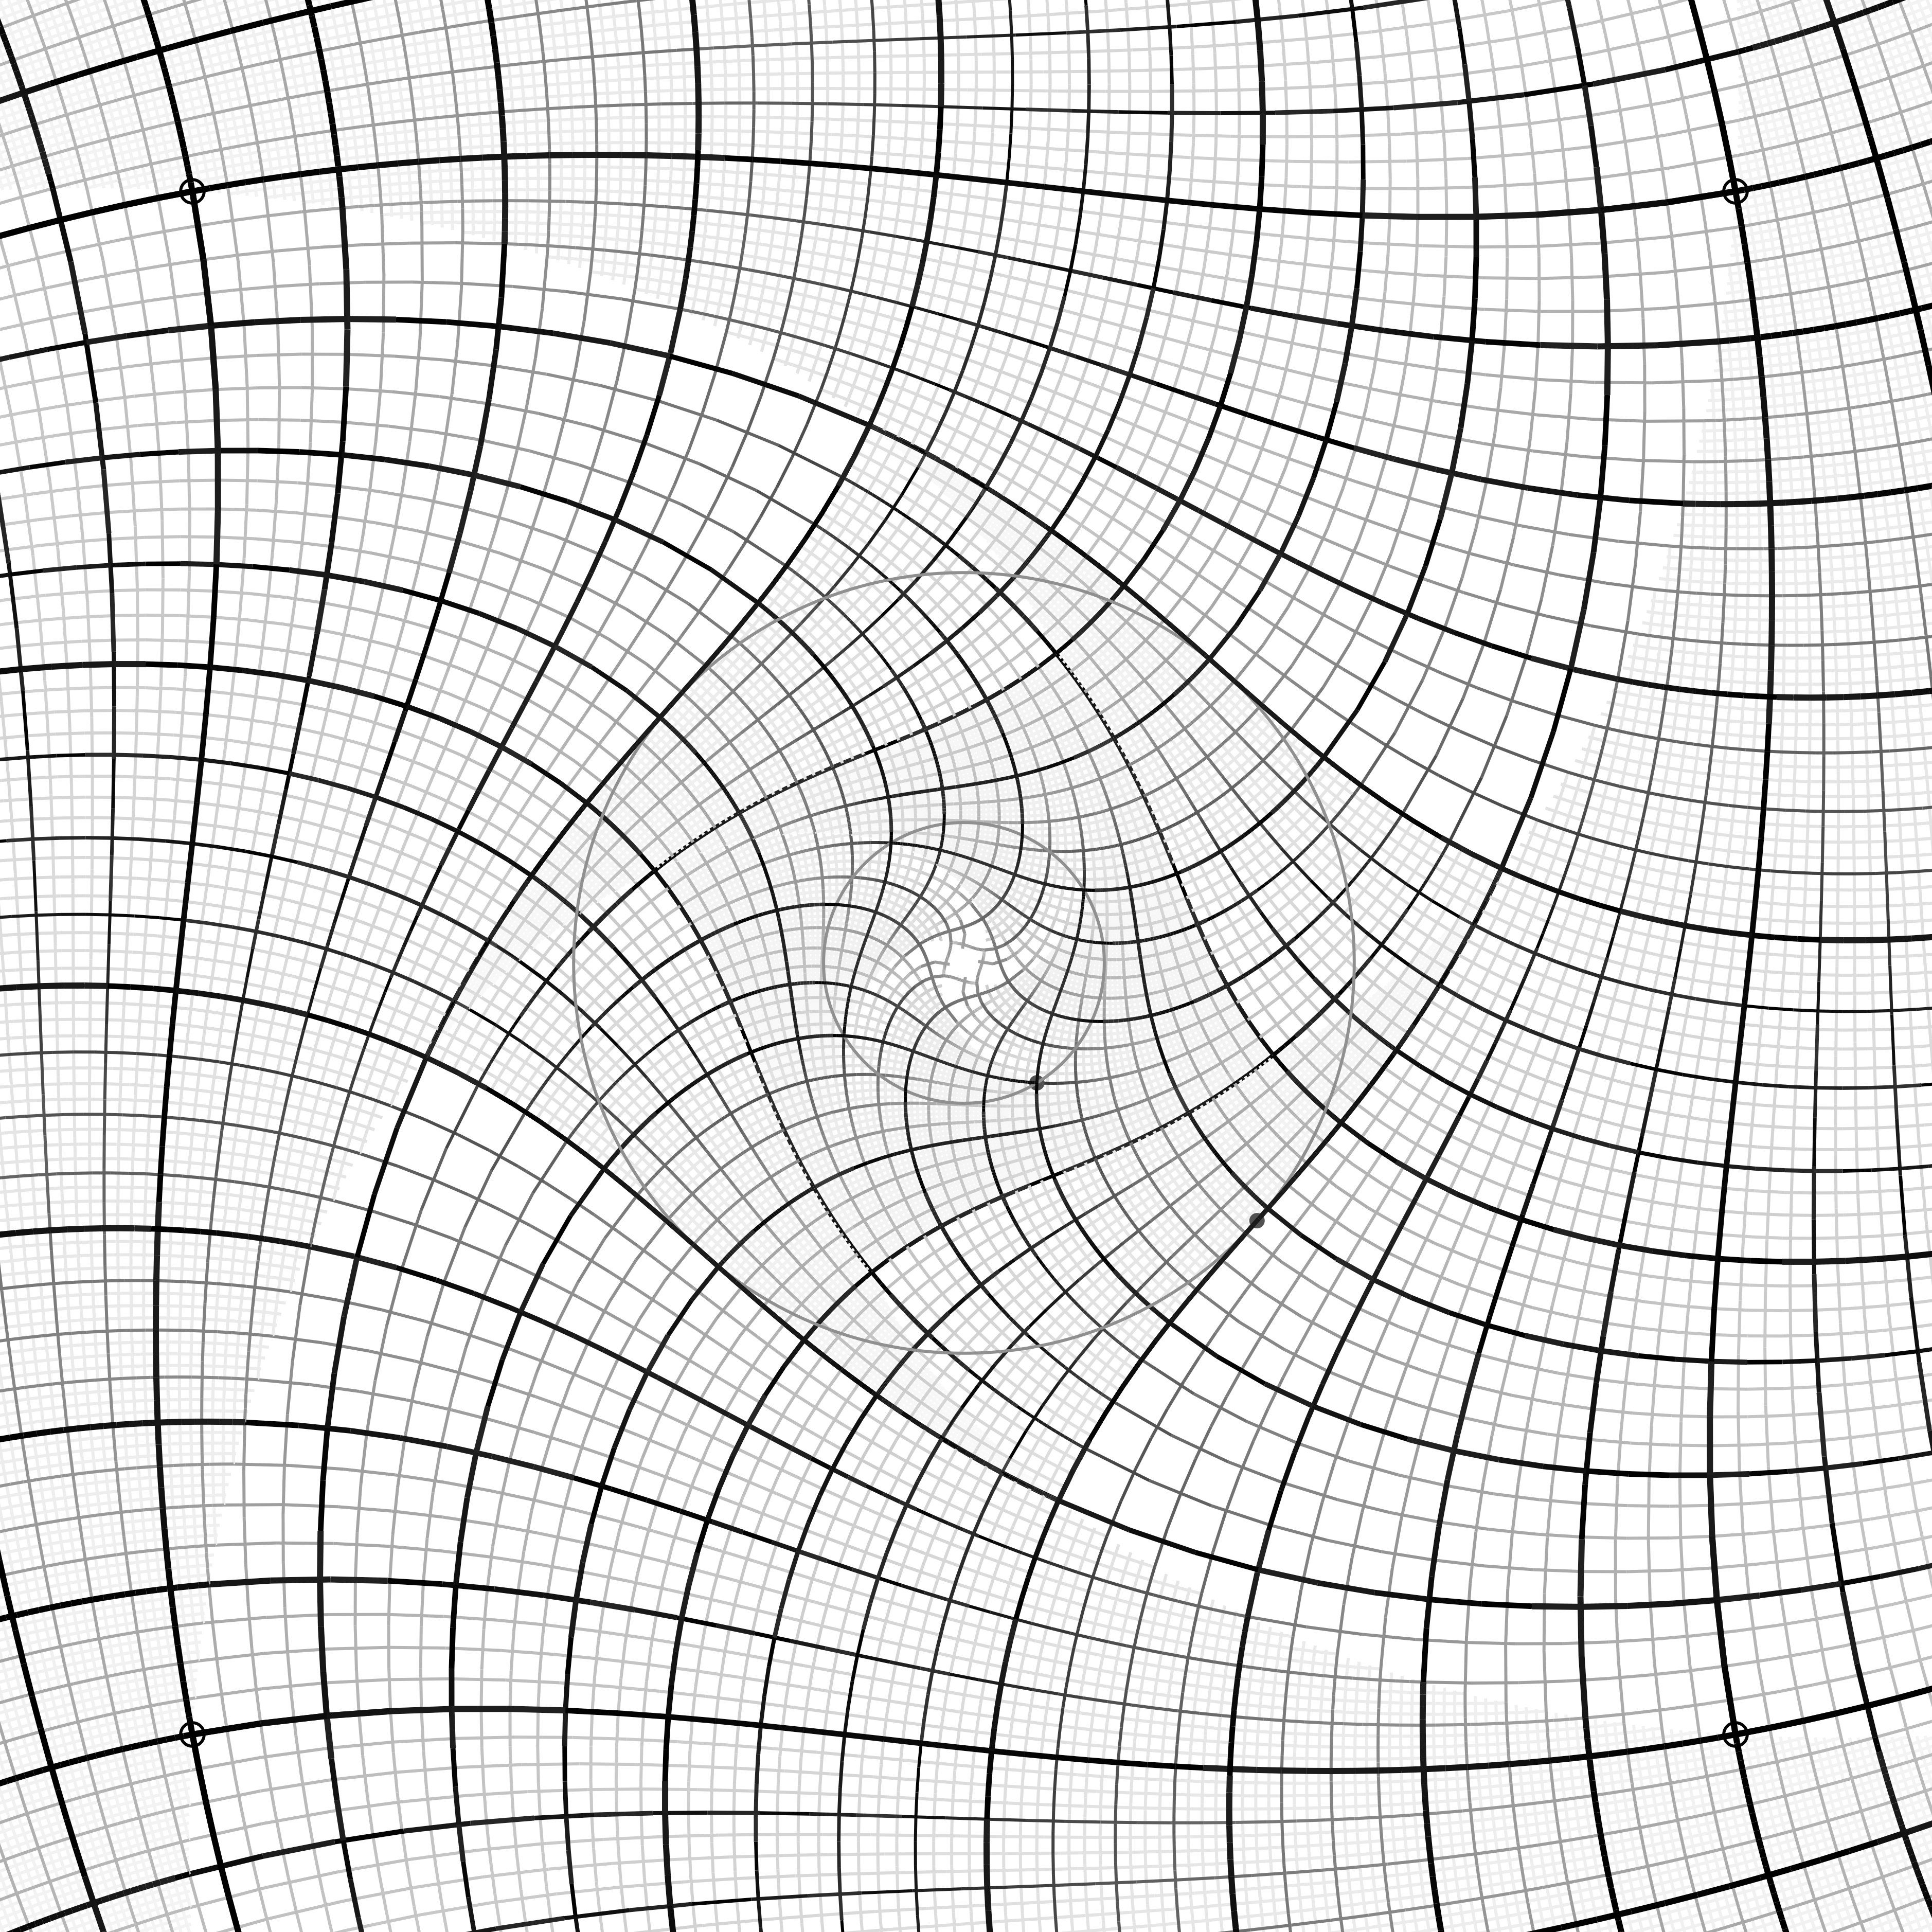
The basic idea is a mapping between the undistorted original or "rectangular" picture or grid, and the final or "curvy" picture or grid. The mapping follows from two requirements:
The program scans pieces of grid in the rectangular world, tracing grid lines in little segments, then translates these segments to corresponding segments in the curvy world, calculates their "weight" (darkness and thickness) based on the mapping's magnification (which changes as you move along lines), and draws the transformed segments. Then coarser, darker grids are drawn on top of the finer grids.
Escher's hand-drawn version, my version, and Lenstra and de Smit's version of the grid (see their paper) all show glitches, discontinuities and inconsistencies. Even with the simple formula above, making those lines come out with non-absurd, continuous thickness, with natural-looking contrast and detail levels, requires some tweaks in the code that I can't fully justify except that they work. Escher himself reported "some almighty headaches" working on "Print Gallery."
So, there are future possibilities. The grid-scanning loops are done in chunks for three concentric bands, with finer resolutions toward the center. Within each band between two and four different grid resolutions are drawn, which makes sense, but the resolutions are hand-picked right now. You can see "teeth marks" in some of the lines because things aren't drawn in the right order. This all ought to be done in a more uniform, principled way.
If you convert the Postscript as it is to PDF, you'll get a multi-megabyte file, because the converter turns every tiny line segment into a separate PDF command. If the program were to draw using Bezier curves (built into both Postscript and PDF), then it could probably produce a much smaller, yet still high-resolution PDF file that wouldn't take forever to render on a screen or printer. Maxim Shemanarev has a great, simple method for turning sequences of points into Bezier curves.
Write me about escher_grid.ps !
Hi-res, uncompressed or least-compression versions of the grid:
| escher_grid_2.tif | (3756 x 3756, 14 MB) |
| escher_grid_2.png | (3756 x 3756, 4 MB) |
| escher_grid_2.jpg | (3756 x 3756, 5 MB) |
| escher_grid_2.pdf | (line art; older computers may have serious difficulties with this one! 1.8 MB) |
--Steve Witham
Up to my home page.